
Can performance data show why solar panel output has dropped?
Yes. Comparing your system’s historical output with sunlight levels, weather and inverter data can show whether reduced generation is linked to shading, dirt, a fault or a wider system issue.
Yes. Performance data can often show whether a fall in solar output is expected or points to a developing problem. The pattern matters more than a single low reading. We compare recent generation with earlier records, weather conditions and the system’s design to identify the most likely cause.
A low figure on its own does not prove that the panels have failed. A cloudy month, shorter winter days or a change in household electricity use can make the system appear less productive. The useful comparison is between similar periods, allowing for daylight levels and weather.
What the data can reveal
- Weather-related variation: generation normally falls during dull weather and in winter. Several low-output days that match heavy cloud may not indicate a fault.
- Shading: generation can fall at particular times when a tree, chimney, building or new obstruction covers part of the array. Repeated dips at the same time of day are significant.
- Dirt and debris: gradual, fairly consistent underperformance across the array may point to bird fouling, dust, leaves or other surface contamination.
- Inverter problems: an inverter portal may show alarms, disconnections, communication failures or repeated shutdowns. A blank monitoring graph can mean that data is not reaching the portal, even when some electricity is still being generated.
- String or connection faults: a sudden step down in generation, or a difference between sections of the array, can point to a tripped isolator, damaged cable, connector issue or a problem affecting one string of panels.
- Meter or monitoring errors: if the inverter display, generation meter and online portal disagree, the system may be producing normally while one source is recording or transmitting the information incorrectly.
Which records help most
The inverter monitoring portal is usually the starting point because it may show daily, monthly and annual generation, live output, fault messages and, on some systems, production from individual sections. Generation-meter readings provide a separate record. Export data can also help, but it does not equal total solar production because electricity used in the home does not pass to the grid.
Historic records are especially useful. A system that has produced steadily for years before dropping suddenly suggests a different problem from one that has underperformed since installation. We look for the date of the change, repeated gaps, unusual midday dips and differences between comparable days.
Weather data and site changes add context. New tree growth, scaffolding, nearby construction or a replacement roof can alter the amount of sunlight reaching the panels. If the output falls only during certain hours, shading is more likely. If it falls throughout the day, soiling, equipment failure or a wider electrical issue becomes more relevant.
Why one figure is not enough
Solar output changes from minute to minute. A cloud passing over the array can create a sharp dip without indicating a defect. Some systems also limit output when the inverter reaches its rated capacity. That limit is normal and is different from a system that cannot reach its previous output under similar conditions.
Panel ageing can contribute to a gradual reduction, but data needs to be considered alongside the system’s age, design and maintenance history. A sudden fall should not be dismissed as normal ageing. Equally, a lower winter total should not be treated as evidence of a failed panel.
What data cannot confirm by itself
Monitoring information can narrow down the cause, but it cannot always locate a physical fault. A portal may show that one string is underperforming without showing whether the cause is a panel, connector, cable, isolator or inverter input. It also cannot reliably identify damage, loose connections or water ingress without appropriate electrical tests and inspection.
Safety matters here. Solar panels can continue producing electricity in daylight, even when the mains supply is isolated. Do not remove covers, disconnect cables or handle rooftop equipment to investigate a low reading.
How we use the information
We begin with the available portal records, generation-meter readings, system details and any inverter messages. If the data points to shading or soiling, the next step may be a visual assessment. If it suggests an inverter, string or connection issue, we can carry out the relevant electrical checks and inspect accessible equipment. Roof access is considered separately from the initial review, based on what the records show and what can be checked safely.
The outcome should distinguish between expected seasonal variation, a monitoring fault and a loss of generation that needs repair. Where the evidence is inconclusive, an on-site investigation may be needed rather than replacing equipment on assumption. That approach gives you a clearer explanation of the reduced output and helps target any necessary work.
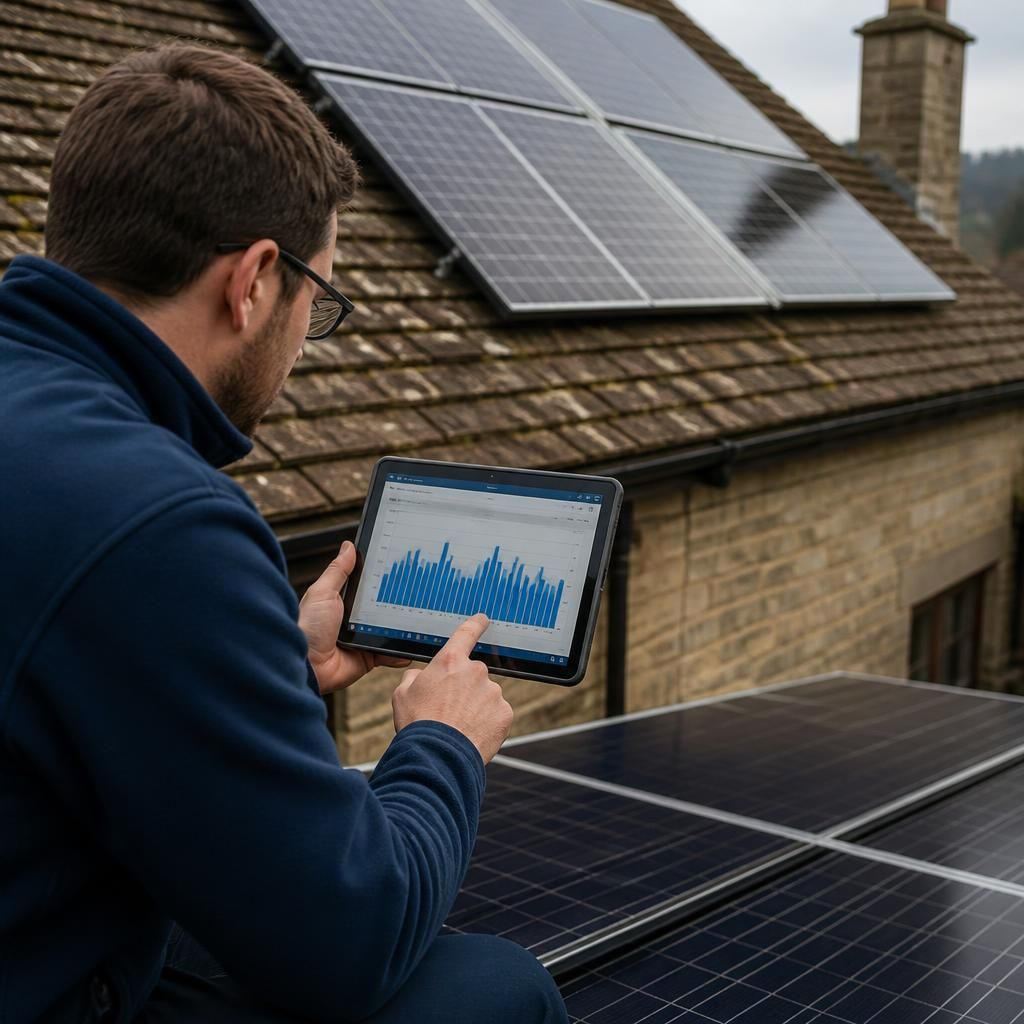
A monitoring graph is only useful when its timestamps match the generation meter. If the inverter clock has changed after a power cut, the portal may place production on the wrong day and make a normal period look unusually low. We check the dates and readings together before treating a reporting mismatch as lost generation.